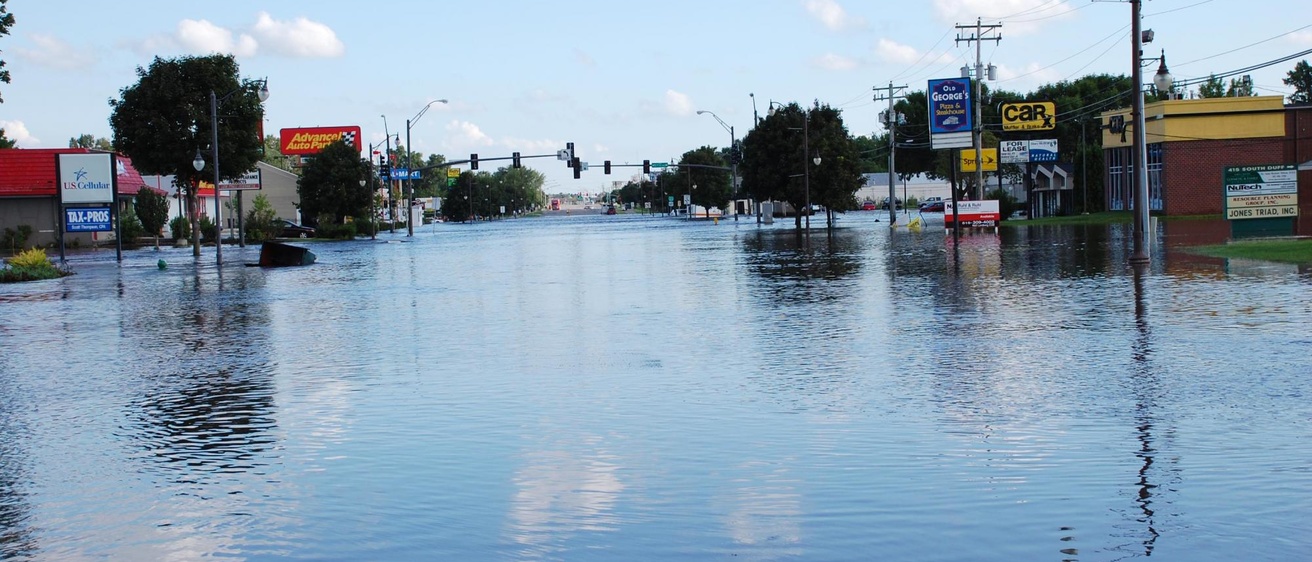
Created in response to the floods that ravaged Iowa City and eastern Iowa in 2008, the Iowa Flood Center at the University of Iowa initially was regarded as a resource only for that part of the state.
“I think early on we did get a lot of questions about that,” says Nathan Young, associate director of the Iowa Flood Center. “Since then, we’ve grown our resources into western and central Iowa.”
Case in point is the city of Ames. In 2011, the Iowa Food Center worked with Ames to create a flood inundation map—one that allows city officials, business owners, and citizens to better predict where the water may go in various flood scenarios on the South Skunk River and Squaw Creek, which converge in Ames.
John Dunn, director of water and pollution control for the city of Ames, said the inundation maps were created as part of a larger flood-mitigation study.
“We wanted to show the city council and the community what the flooding risks really were in Ames,” Dunn says.
Since then, the flood-inundation maps also have been used during actual storm events, Dunn says.
“Both we and the facilities folks at Iowa State University have used those models when storm events are coming up,” he says. “Anybody who is in an emergency response capacity can jump on those flood maps and see a pretty decent inundation map.”

Young says it takes experts at the flood center a couple of months to develop a hydraulic model such as the ones used in Ames. The models are created by integrating data about the river channels, topographical information from the flood plain, and structures in the waterway, such as bridges and low head dams, Young says.
“We build a computer model that allows us to take water flowing into the community at the upstream end and predict how it’s going to propagate through the stream or through the plain and predict flood hazards,” he says.
Young says the models are then calibrated using actual high-water marks to make sure they are running correctly.
The finished Ames model is capable of running 928 simulations based on different water flow levels on the South Skunk River and Squaw Creek, Young says. With the inundation map, anyone can input a forecast, pull up the map, and see how flooding may or may not affect them, including not just where the water will go, but how deep it will be.
“You can zoom into your own house and check the water depth,” Young says.
While no two storm events will respond exactly the same, Dunn says the map is still a valuable tool for homeowners and business owners.
“I think it’s really helpful for the layperson to be able to jump on there,” Dunn says.
The Iowa Flood Center has created 25 flood maps across the state of Iowa, at no cost to the communities.
“We’ll either be engaged by a community that’s had an ongoing flood problem or we’ll be aware of an ongoing flood problem in the community and approach them,” Young says. “It’s free of charge and beneficial to them—they’re rarely resistant to it.”
