Within 24 hours of the earthquake that struck central Italy last month, Bill Barnhart was producing information to help the global community estimate deaths and damage.
Barnhart, an earthquake specialist at the University of Iowa, analyzes where and how much the ground moves during a quake, then supplies that intelligence to the U.S. National Earthquake Information Center (NEIC), part of the U.S. Geological Survey. The center, which monitors all major earthquakes worldwide, packages the data into a “ShakeMap,” which emergency responders, governments, and financial institutions use to gauge the earthquake’s toll on people and property.
“The more information you have soon after an earthquake, the better the response decision-making is,” says Barnhart, assistant professor in the UI Department of Earth and Environmental Sciences.
The Aug. 24 earthquake in Italy measured magnitude 6.2 on the Richter scale and killed at least 295 people, injured 400, and nearly leveled entire communities. As temblors go, it wasn’t that powerful, Barnhart says, but it wrought significant damage and death both because it occurred close to the Earth’s surface and because a number of towns and villages were located in the affected area.
“It was high impact,” he says.
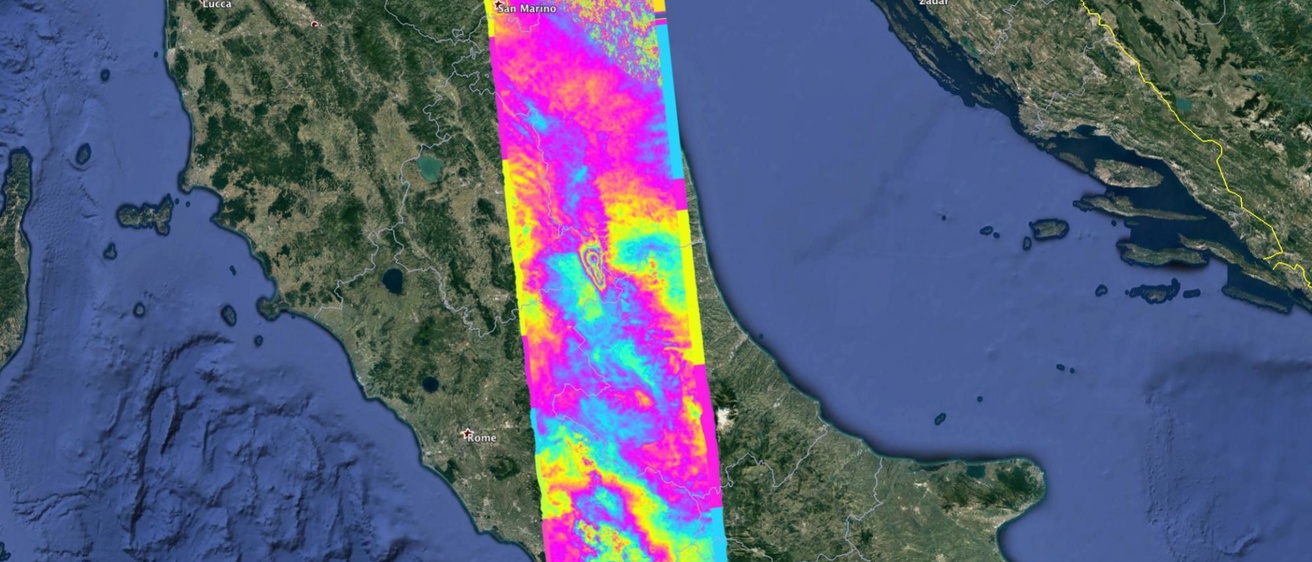
Within a day, Barnhart used satellite imagery to measure the extent to which the earthquake moved the Earth's surface. He determined the ground shifted more than six inches.
Next, Barnhart used radar imagery to figure out exactly where the fault plane slipped underground, which is an important step in determining a quake’s depth. That gave him the equivalent of a below-surface, three-dimensional view of the slip zone.
“It’s like sitting underground and seeing where the ground slipped,” he says.
With that information in hand, Barnhart produced color-coded models showing the earthquake’s depth and slip zone. On his computer, he points to one of the images, which shows where the slip happened. It looks like a thumb print.
Barnhart sent that and other images he had produced to the USGS, the agency responsible for disseminating earthquake information to the public.
The USGS incorporated Barnhart’s analysis into a “ShakeMap” that shows the rippling effects of the quake from the epicenter, with zones separated by the perceived intensity of the quake as it radiated from the impact center. The USGS also uses Barnhart’s information for PAGER, an online resource that provides a running estimate of the number of people affected by a quake, the cities exposed, and potential economic losses, among other indicators. Agencies and governments worldwide rely on the estimates to guide their response.
Barnhart learned his trade when he was a post-doctoral researcher at the NEIC, which is located in in Golden, Colorado. Since coming to the UI in January 2015, Barnhart has continued supplying earthquake impact data to the USGS. In the last year alone, he has produced ground deformation reports for major quakes that struck Nepal, Chile, and Japan.
He’s a one-person quake analysis team for now, although he’s training graduate students in the department to eventually help.
“I do it because it has societal value,” he says. “Why wouldn’t I do it? If I were just making some pretty pictures, I probably would have stopped.”
