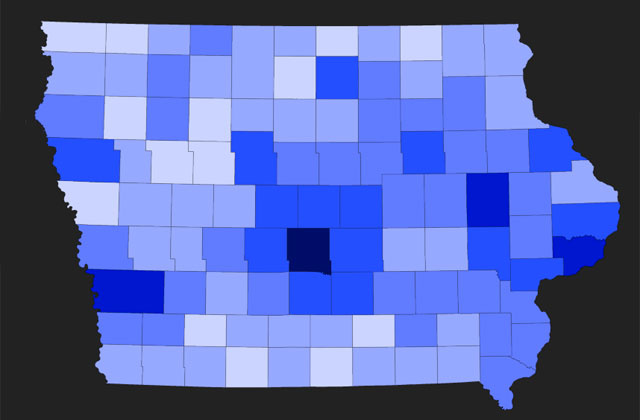
Iowans now have a free, interactive map that shows foreclosures, county-by-county, from the recession onward.
The University of Iowa's Public Policy Center (PPC) on Thursday made public the Iowa Foreclosure Events Trend Map, which tracks state and county-level foreclosure trends for each of Iowa’s 99 counties. By selecting a statewide view or particular county on the Iowa map, users can study the number of foreclosures by quarter from 2006 through 2015. This is the first time foreclosure process data have been made available at no cost to the public. The grant for the project came from the attorney general's office in Iowa.
“This interactive map is a great tool for those who monitor and study foreclosure trends,” Attorney General Tom Miller says. “It’s also informative for anyone who wants to know how the foreclosure crisis has impacted the state, their county, or other counties.”
The counties with the highest number of foreclosures during the fourth quarter of 2010, which was the peak of the foreclosure crisis for Iowa, were: Polk (1,332), Linn (313), Scott (290) and Pottawattamie (175).
“We designed the map to make Iowa foreclosure events data easily accessible and understandable,” says Jerry Anthony, director of the PPC's housing and land use policy program. “Iowa's citizens as well as public, private, and nonprofit leaders will now have better information to guide their decision making.”
While data shows the worst of the foreclosure crisis is over, more than 9,000 residential loans in Iowa entered foreclosure in the second quarter of 2012. That indicates that many Iowans are still at risk of losing their homes. Housing and land use policy program staff will post quarterly reports analyzing foreclosure trends statewide.
The data was purchased from RealtyTrac, which "collects and aggregates foreclosure data from more than 2,200 counties, covering more than 90 percent of U.S. households," according to the firm’s website. The money used to buy the data came as the result of Attorney General Miller's successful pursuit of the $25 billion national joint federal-state settlement over mortgage foreclosure abuses, fraud, and unacceptable nationwide mortgage servicing practices.
“The Public Policy Center staff has done a wonderful job with this interactive map,” Miller says. “It really puts Iowa’s foreclosure problem into perspective.”