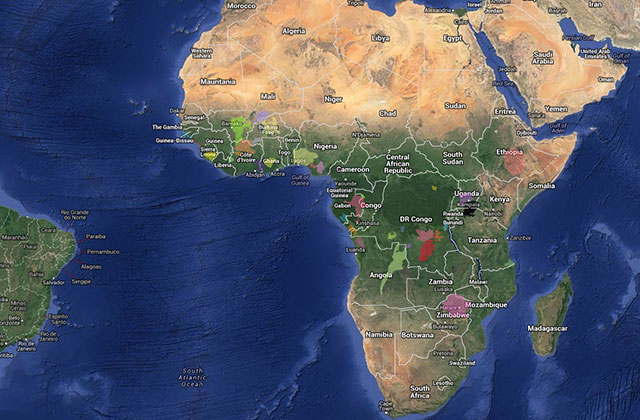
If you’ve used Google Maps recently—with options to view a city’s weather, terrain, traffic conditions, bike trails, even videos, photos, and relevant Wikipedia articles—you know a map can tell you a whole lot more than where you are and where you’re going.
Geographers know this better than anyone. For more than a century, they’ve built and used maps to study the physical, climatic, economic, political, and cultural characteristics of different regions, and the relationships between them. Maps are especially essential for identifying patterns: even if you know the rates of, say, soil erosion across 10 Iowa counties over the past five years, the data may not resonate until you see it represented on a map. Plot multiple sets of data alongside each other, and suddenly patterns emerge and questions arise: Could erosion be linked to urban sprawl?
GIS is still used primarily in the applied sciences, and in some interesting ways at the University of Iowa. Kathleen Stewart, UI associate professor of geographical and sustainability sciences, used it to create HawkEvac for campus flood planning after the 2008 flood, and Dave Bennett, professor and chair of that department, uses it to study the processes and effects of environmental decision-making.
Now, a new, some might say unlikely, group of scholars are using digital mapping technology to answer their own questions:
- "Would Robert E. Lee have been able to see Union forces on the far side of the battlefield when he ordered the notorious Pickett’s Charge?"
- "Why did African American families settle almost exclusively on the near north side of St. Louis in the 1940s?"
- "How and where did globetrotting, 17th-century Dutch traders leave marks of their flourishing culture?"
Humanities researchers—historians, linguists, philosophers, cultural studies researchers, and literary scholars—are increasingly taking a spatial look at what they do, and the interactive, richly sourced maps they’re creating are opening up new opportunities for humanities scholarship, teaching, and outreach.
Maps, maps, everywhere
Simply put, a digital map is a front-end mapping application (think Google Earth) married to a geographic information system, or GIS, a powerful computer system that stores, displays, and analyzes data associated with a geographic location.
Originally developed for environmental scientists, geographers, resource managers, and urban planners in the early 1960s, GIS was primarily used to map geographic areas, store geographically referenced data (precipitation or pollution levels, say), and use that data to generate layers that could be used to build further maps. Researchers could then study the spatial patterns that emerged.
But, says Dave Bennett, professor and chair of the UI Department of Geographic and Sustainability Sciences, GIS software was expensive in those days and required specialized computers to run. It was only in the mid- to late-'90s, he says, with the arrival of more powerful and affordable micro-computers, that GIS really took off. Social and political scientists began using the software to map and analyze census data, even starting to explore its use for political redistricting. Archeologists also came onboard quickly, using GIS to map data at excavation sites, predict the location of other sites, and study the relationship between topography and the distribution of artifacts in an area.
Then, right around the turn of the 21st century, the Esri company released ArcGIS (now the industry standard geographic information system) for Microsoft Windows; AOL introduced MapQuest; the first consumer GPS navigation devices came onto the market; and the National Spatial Data Infrastructure initiative began digitizing and freely distributing mapped data produced by the U.S. Census Bureau, the U.S. Geological Survey, and other U.S. agencies.
Interest in digital mapping exploded, including among humanities researchers, who quickly found uses for GIS. They embraced in particular the opportunity to create “deep maps,” or digital maps that could contain, in addition to quantitative data, photographs, video, audio, archival records, even relevant bibliographies. Maps that could synthesize material from various disciplines, reveal patterns and relationships in both time and space, and provide a dynamic new way to conduct and share research.
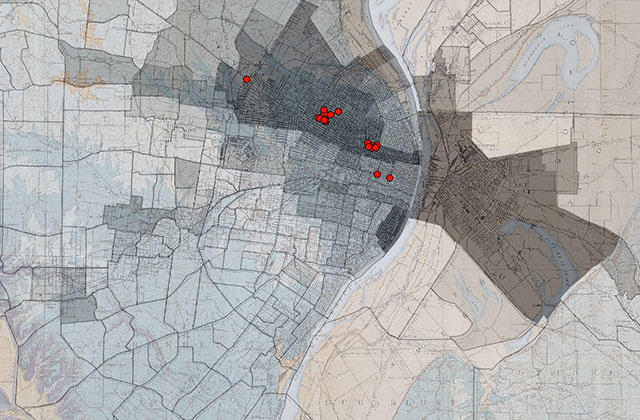
50 layers of St. Louis and 400 years of Dutch art
“GIS allows us to test spatial relationships and change over time in ways that we couldn’t before,” says Colin Gordon, UI professor of history in the College of Liberal Arts and Sciences.
He created an interactive digital map to accompany his 2008 book Mapping Decline: St. Louis and the Fate of the American City. The map uses archival, demographic, and political data to trace the transformation of metropolitan St. Louis in the 20th century. Gordon’s map contains more than 50 overlays—transparent layers of information that users can view superimposed on one of several maps of the city—containing demographic data, zoning maps, poverty maps, and even photographs associated with the different locations.
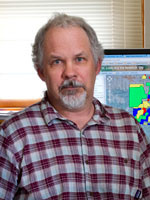
“The important thing for me wasn’t just the ability to map things,” Gordon says, “but the ability to pull up different layers and see the relationship between them”—between factory closings and poverty rates in a certain part of town, for instance, or between minority population figures and race-restrictive deed covenants.
The ability to toggle overlays on and off is a key feature of GIS, and one that makes digital maps so useful to a variety of audiences. Gordon has presented Mapping Decline to St. Louis planning groups, transportation planners, engineers, and the Equal Opportunity Housing Council, in addition to fellow academics: “They’re all able to go in and use the parts of the project that best fit their needs.”
Practically speaking, a project like his could have been done 50 years ago, using transparency film as overlays—but, Gordon smiles, “It would have taken longer.” And not only that: it probably would have been too expensive to print.
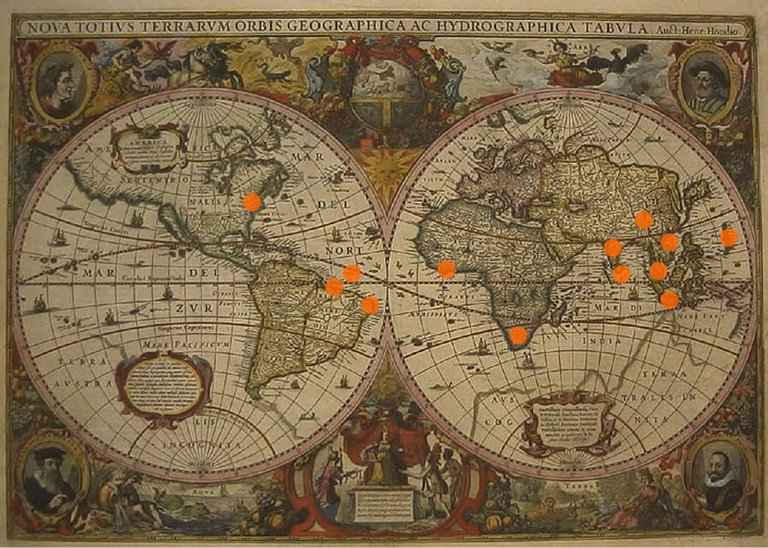
Julie Hochstrasser, UI professor of art history, turned to the digital realm for her research project The Dutch in the World, wanting to plot her data geographically as well as include video footage.
Anticipating that the project would require technical expertise beyond her own, she applied for and received an early UI Digital Arts and Humanities Initiative grant (offered through the Digital Arts and Humanities Initiative and the Iowa Digital Library), which provided her with web development support.
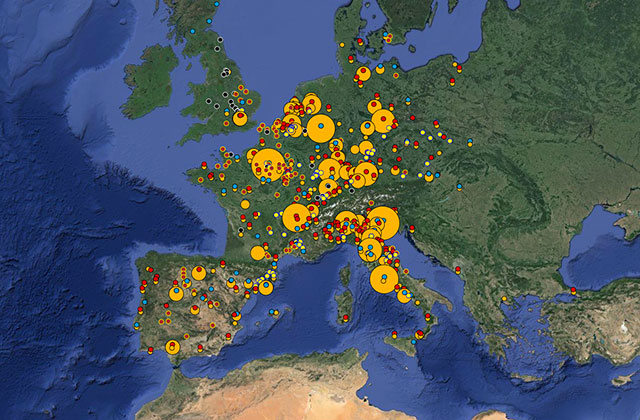
“The Dutch in the World” is still in its early stages, but it will eventually identify important sites of 17th-century Dutch trade and provide a spatially contextualized, visual catalog of Dutch-influenced objects found at those sites—i.e., hundreds of photos and videos, taken by Hochstrasser, of objects that “register an exchange between early modern Dutch traders and various cultures—everything from painting, drawing, and sculpture to architecture, furniture, and porcelain.” Once the site is finished, Hochstrasser says she’d like to use the data to develop a mobile app for people to use when traveling to the different locations.
“The way you can crystallize data and visualize historical transformation with digital mapping is really exciting,” she says, recalling the emergence of an early picture of globalization as she and her team compiled their data. “We usually talk about the present when we talk about globalization, but when you look at a map like this, you can see that the process started long, long ago.”
Pitching in, sharing results
Because digital maps are often developed online, it’s easy for multiple researchers to contribute to the projects, and from all corners of the world.
As Hochstrasser puts it, “GIS can make huge projects so easy. We’re talking about work that would take a single scholar a lifetime to achieve. But with the new technology, everyone can pitch in, and the results are visible in the blink of an eye.”
She’s referring both to collaborative scholarship among colleagues and to crowdsourcing, or inviting the public to contribute relevant data via the web.
Gordon’s newest mapping project, Digital Johnson County (which, when finished, will document the social, natural, and political history of Johnson County, Iowa) will allow students and others to log in, upload photographs, and create layers using the plat maps and survey data that they’ve gathered.
Hochstrasser, too, uses her GIS project in the classroom, both as a pedagogical tool and as a research opportunity.
Bennett says that as GIS becomes more and more ubiquitous in our daily lives, we’ll see more “community-based research, where people put information onto the map,” either manually or via sensor networks feeding back into spatial databases.
Finally, digital maps provide an ideal way to communicate spatial information. “People are much more responsive to visual evidence than they are to other kinds of evidence,” notes Gordon. “And that’s especially true when it’s delivered in an everyday and accessible medium, like a map. This kind of research combines historical imagery and data with familiar geographies and landmarks.” This is what makes digital maps such useful tools for sharing scholarship with the public—and for helping to raise funds for humanities research.
GIS fever
Faculty aren’t the only UI community members excited about GIS.
According to Bennett, “There’s a groundswell of interest on campus. Students in the humanities, political science, sociology, geoscience, environmental sciences—we see them in our classes; they’re wanting to use GIS.”
In fact, the classes are so popular that the Department of Geographical and Sustainability Sciences has just added a GIS minor, whose curriculum includes courses in remote sensing, global positioning, and GIS software.
“We believe the minor will help students not only to find their first job,” he says, “but also as they grow past that; it’s a skill that can complement a wide variety of disciplines.”
The department also offers three-hour GIS workshops for any member of the UI community who wants to learn the basic functions of ArcGIS. (Contact Marc Linderman for information and a schedule of upcoming workshops.)
Another campus resource for students, faculty, and staff looking to explore digital research projects, including GIS mapping, is The Studio for Public Digital Arts and Humanities. Directed by Jon Winet, professor of Intermedia in the UI School of Art and Art History, "The Studio" as it's called in short, provides project development and technical support for public digital humanities research, scholarship, and learning. Their first project was the geospatial City of Lit Mobile App.
In spring 2013, the group collaborated with Mark Hale of ITS, the Department of Geographical and Sustainability Sciences, and many other UI units to organize GIS-A-Palooza, a free, campus-wide event featuring GIS lectures, discussions, and demonstrations; it was such a success that they’re already planning another.
Other spatial humanities projects at Iowa include Björn Anderson’s digital map of the sites of Levantine ceramics; Bob Cargill’s digital reconstruction of the Biblical city of Azekah, Israel; the University of Iowa Museum of Art Mapping Project, which pins artworks from the museum’s collections to their places of origin; AIDS Quilt Touch, a mobile web app created by studio staff that lets users search and navigate the 48,000 blocks of the AIDS Memorial Quilt; and Greg Prickman’s Atlas of Early Printing, which traces the expansion of printing in 15th-century Europe using an animated map.
Room to grow
Esri president Jack Dangermond has a well-known saying: “The application of GIS is limited only by the imagination of those who use it.” Humanities scholars—an imaginative bunch—know that’s not quite the case (at least, not yet).
As with any product used by a population for whom it wasn’t developed, the technology has its limitations. Some are practical and will likely be addressed as the software improves, such as ArcGIS’s still-beta animation of change over time. Others are inherent and more difficult to address. One such concern is that GIS maps are built using geometric space and a Western spatial perspective. Some humanities scholars worry that GIS can’t sufficiently render different—more subjective, less mathematical— conceptions of space, or non-Western views of the world.
Gordon articulates another drawback, but it’s one that he admits can also be a benefit: “It’s hard to control the narrative. A generation ago, this kind of research was much more an exercise in cartography: maps were a static product. People didn’t zoom around on them or change their layers. But with a digital map, if I want to say that the fundamentally important thing is the relationship between A and B, who’s to prevent someone else from saying, no, it’s the relationship between B and C, or A and C, or something else?” Digital maps can tell a lot of stories and allow various interpretations—sometimes for better, sometimes for worse.
For all that, though, digital mapping offers exciting possibilities for humanities scholarship, outreach, and teaching. It’s also a perfect avenue for interdisciplinary collaboration—between, say, humanities researchers new to GIS and spatial scientists who’ve been using it for decades.
In Bennett’s words, “Many of us geographers would be interested in working with humanities researchers. If we work together, maybe we can find even more creative ways to use GIS.”
Imagine those maps.
•••••
For more detailed discussion of the use of GIS in the humanities, see the book The Spatial Humanities: GIS and the Future of Humanities Scholarship (Indiana UP, 2010; Bodenhamer, Corrigan, Harris, eds).